
Vietnam’s cashew trade closed the third quarter of 2026 with substantial international activity. This review covers September 2026, the full third quarter from July through September, and the cumulative period from January 1 to September 30, 2026.
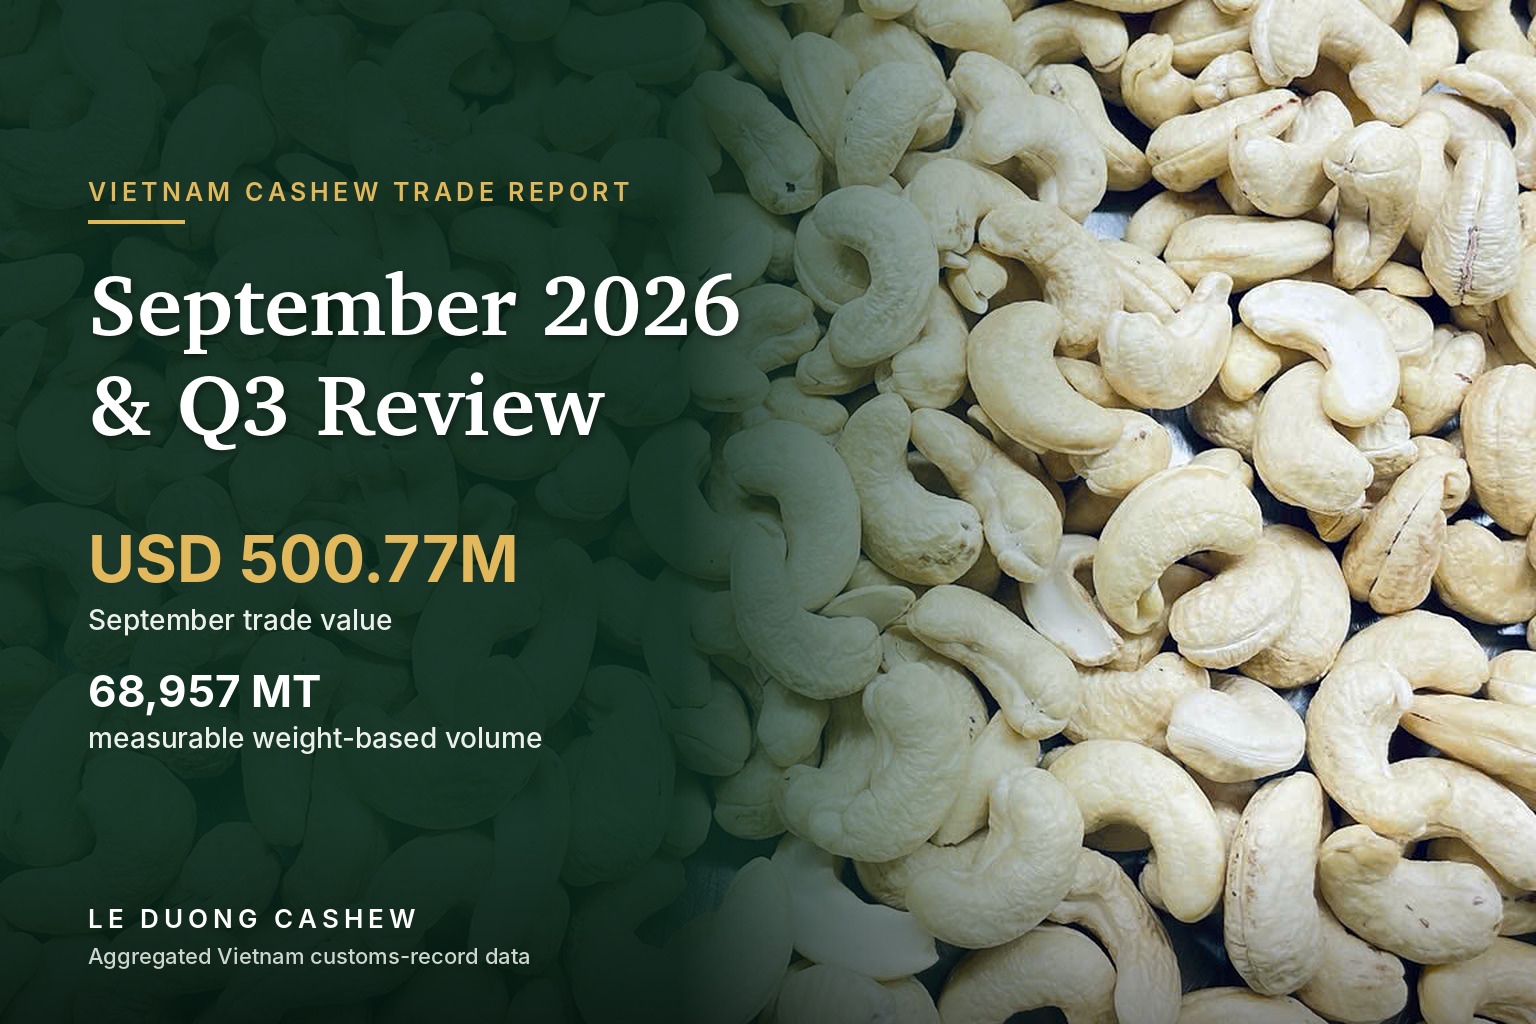
Based on the customs-record database reviewed by Le Duong Cashew, September generated USD 500,771,381.66 in cashew trade value. Measurable weight-based shipments totaled 68,957.269 MT. For Q3, cumulative value reached USD 1,566,356,847.96, while measurable volume totaled 216,323.420 MT. Across the first nine months of 2026, the database records USD 4,160,315,596.39 in trade value and 585,077.627 MT of measurable weight-based volume.
These figures are aggregated Vietnam cashew customs and trade data. They are not the sales, production, customer, market-share or shipment performance of any individual company. No volume has been estimated for records declared only in packaging or other non-weight units.
Key takeaways
- September 2026: USD 500.77 million and 68,957.269 MT.
- Q3 2026: USD 1.566 billion and 216,323.420 MT.
- January–September 2026: USD 4.160 billion and 585,077.627 MT.
- September value declined 2.93% month on month, while measurable volume declined 3.42%.
- Q3 value was 5.62% below Q2, while measurable volume was 7.13% lower.
- On a like-for-like HS 08013200 kernel basis, January–September 2026 value was 22.16% above the same period of 2025 and measurable volume was 13.80% higher.
- WW320 remained the largest explicitly identified kernel grade by volume in September, followed by WW240 and WW180.
KPI snapshot
| KPI | September 2026 | Q3 2026 | Jan–Sep 2026 |
|---|---|---|---|
| Trade value | USD 500,771,381.66 | USD 1,566,356,847.96 | USD 4,160,315,596.39 |
| Measurable quantity | 68,957.269 MT | 216,323.420 MT | 585,077.627 MT |
| Customs declarations | 3,445 | 10,753 | 29,440 |
| Normalized buyer entities | 733 | 1,371 | 2,448 |
| Destination markets | 81 | 95 | 113 |
| Weighted value on weight-based rows | USD 7.1869/kg | USD 7.1515/kg | USD 7.0299/kg |
The weighted USD/kg figures use only rows whose units can be converted exactly into kilograms. Valid USD values from packaging-unit transactions remain in total trade value, but their quantities are excluded from the weight denominator.
September 2026: moderately softer activity after August
September trade value of USD 500.77 million was 2.93% below August’s USD 515.88 million. Measurable shipment volume decreased from 71,399.240 MT in August to 68,957.269 MT in September, a month-on-month decline of 3.42%.
Customs declarations eased from 3,551 to 3,445, while normalized buyer entities declined from 803 to 733. Despite lower physical volume, weighted value on weight-based transactions increased slightly from USD 7.1626/kg in August to USD 7.1869/kg in September. The change therefore reflects lower activity and measurable tonnage more than an equivalent deterioration in aggregate value per kilogram.
September year-on-year comparison
A like-for-like comparison using HS 08013200 cashew kernels provides the cleanest comparison with September 2025. September 2026 kernel trade value reached USD 500,761,895.53, up 3.38% from USD 484,402,003.54 one year earlier. Kernel volume was 68,957.269 MT, down 3.43% from 71,405.860 MT. Higher value combined with lower tonnage indicates stronger aggregate value realization per kilogram in the comparable kernel segment.
Q3 2026 review
| Month | Trade value | Measurable volume |
|---|---|---|
| July 2026 | USD 549,704,902.60 | 75,966.911 MT |
| August 2026 | USD 515,880,563.71 | 71,399.240 MT |
| September 2026 | USD 500,771,381.66 | 68,957.269 MT |
| Q3 total | USD 1,566,356,847.96 | 216,323.420 MT |
Monthly value moderated sequentially through the quarter. Compared with Q2 2026, Q3 trade value decreased 5.62%, measurable volume decreased 7.13%, and customs declarations declined 4.38%. Weighted value on weight-based transactions nevertheless increased from USD 7.0506/kg in Q2 to USD 7.1515/kg in Q3.
For a consistent year-on-year comparison, HS 08013200 kernels were isolated because the 2025 database contains a materially larger in-shell component. On that basis, Q3 2026 kernel value increased 52.74% and measurable kernel volume increased 42.96% from Q3 2025.
January–September 2026 performance
The nine-month period contains 29,440 unique customs declarations, 2,448 normalized buyer entities and 113 normalized destination markets. On the comparable HS 08013200 kernel basis, value rose from USD 3,404,939,049.07 in January–September 2025 to USD 4,159,312,295.58 in the same period of 2026, an increase of 22.16%. Measurable kernel volume increased 13.80%, from 513,761.077 MT to 584,664.271 MT.
Product and grade mix
Grade analysis uses only explicit codes found in source product descriptions; no grade was inferred from price, destination or other indirect information.
- WW320: 19,704.859 MT, or 28.58% of measurable September kernel volume.
- WW240: 11,239.552 MT, or 16.30%.
- WW180: 4,467.237 MT, or 6.48%.
- LP: 1,525.357 MT, or 2.21%.
- WW450: 848.585 MT, or 1.23%.
Approximately 41.56% of measurable September kernel volume did not contain a recognized explicit grade code and remains classified as unspecified. Across Q3, WW320 represented 31.58% of measurable kernel volume, WW240 accounted for 17.50%, and WW180 for 7.01%.
Destination and shipping structure
September shipments covered 81 normalized destination markets, compared with 78 in August. The two largest destinations represented approximately 38.55% of measurable September tonnage, showing broad international reach alongside meaningful concentration in several high-volume markets.
FOB remained the largest Incoterm category in September at 45.69% of measurable volume. Other major terms included DAP at 19.10%, CFR at 14.18%, DAF at 10.63% and CIF at 8.85%. The broadly stable contractual delivery mix suggests that logistics structure did not change dramatically as monthly throughput moderated.
Outlook for Q4 2026
The data supports a cautiously constructive outlook. Comparable kernel value and measurable volume remain clearly above the same nine-month period of 2025. At the same time, the sequential reduction from July through September means buyers and suppliers should monitor order flow, destination demand, grade availability and logistics execution closely.
Key indicators include monthly kernel shipment volume, weighted USD value per kilogram, WW320 and WW240 participation, buyer activity across destination markets, Incoterm mix, and whether October–December volume stabilizes after the Q3 moderation. No numerical Q4 forecast is presented because the source database does not contain verified forward orders.
Le Duong Cashew perspective
For international buyers, the data continues to underline the depth of Vietnam’s cashew supply network, particularly in mainstream kernel grades. Le Duong Cashew will continue to monitor trade flows, grade availability and market developments to support buyers seeking clear specifications, consistent quality and reliable export execution.
Planning your next cashew sourcing program? Review our cashew kernel range, learn how to order, or submit a B2B quotation request.
Methodology and data disclaimer
The review uses monthly customs-record workbooks covering January–September 2026 and comparable 2025 kernel records. USD value uses a direct source field where available; otherwise it is calculated as declared quantity multiplied by declared USD unit price. Weight includes only exact mass conversions. Packaging, bag, piece or set units are not estimated in kilograms. Duplicate overlap between monthly source files was removed through declaration, product, quantity and buyer-key matching.
All figures are aggregated Vietnam cashew customs and trade data. They are not the sales, production, customer, market-share, shipment, growth or performance data of any individual company. No customer names, customer-specific prices, contract numbers, addresses, phone numbers or email addresses are disclosed.