Vietnam’s cashew export data for 1–31 August 2026 presents a mixed monthly picture. Compared with July, transaction count fell 2.54%, export volume declined 7.55%, and total export value decreased 6.15%. At the same time, average customs value per kilogram increased 1.65%, from USD 6.88/kg in July to USD 6.99/kg in August.
That combination matters to international cashew buyers, importers, distributors and food manufacturers. Lower monthly tonnage did not lead to an equal decline in average value per kilogram. The data does not provide a universal price for every grade, specification or contract, but it gives procurement teams a useful trade-level view of Vietnam’s August export flows.
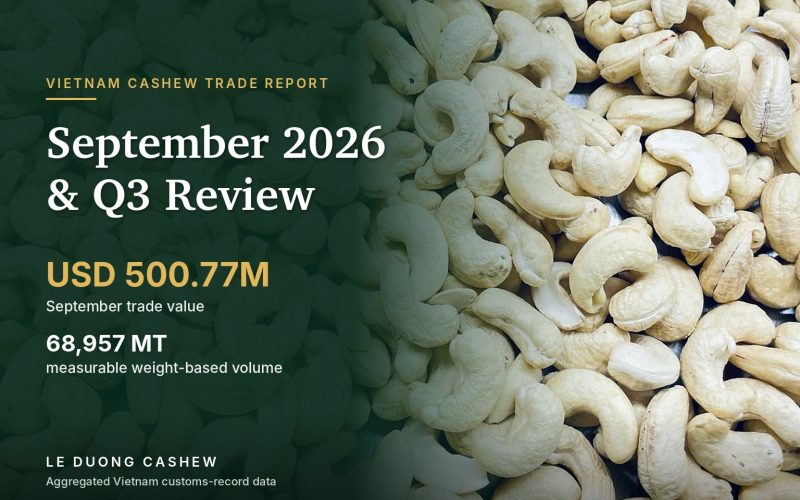
Across 4,792 transactions, Vietnam exported 73,811.98 metric tons of cashew kernels with a total customs/trade value of USD 515,880,563.71. The dataset covers 348 exporters and 78 recorded import markets. Only HS 08013200 appears in the August file.
August 2026 Vietnam cashew export performance
- Transactions: 4,792
- Export volume: 73,811.98 MT
- Export value: USD 515,880,563.71
- Average customs value: USD 6.99/kg
- Recorded import markets: 78
- Importer records before full normalization: 925
- HS code present: 08013200 only
For comparison, July 2026 recorded 4,917 transactions, 79,839.93 MT, USD 549,704,902.60 in value, and an average customs value of USD 6.88/kg.
Month on month: lower volume, higher average value
From July to August, transaction count decreased 2.54%, volume declined 7.55%, and total export value fell 6.15%. Average value per kilogram, however, increased 1.65%.
For procurement teams, the picture is more nuanced than simply saying exports fell. Physical shipment volume and aggregate value moved lower, while the average value embedded in the customs data moved higher. Value per kilogram can reflect grade mix, destination mix, packaging, contract structure and other variables not broken out in this dataset, so it should be treated as an aggregate indicator—not a benchmark or offer for a particular purchase.
China, the USA and Singapore remained the top three markets
Vietnam’s largest August destinations by volume remained China, the USA and Singapore. Together, these three markets represented 45.96% of reported August volume.
| Market | Volume (MT) | Share | Export value (USD) | Avg. USD/kg |
|---|---|---|---|---|
| China | 14,880.93 | 20.16% | 111,207,804.40 | 7.47 |
| USA | 12,170.86 | 16.49% | 83,726,299.31 | 6.88 |
| Singapore | 6,875.58 | 9.31% | 48,127,019.33 | 7.00 |
| Viet Nam* | 5,043.40 | 6.83% | 36,922,188.86 | 7.32 |
| UAE | 4,919.07 | 6.66% | 36,739,742.39 | 7.47 |
| Turkey | 3,726.37 | 5.05% | 29,097,940.44 | 7.81 |
| Netherlands | 2,906.36 | 3.94% | 18,635,363.91 | 6.41 |
| UK | 2,131.28 | 2.89% | 12,954,689.65 | 6.08 |
| Germany | 2,028.86 | 2.75% | 13,346,991.88 | 6.58 |
| Australia | 1,434.42 | 1.94% | 9,226,529.73 | 6.43 |
*“Viet Nam” is retained exactly as recorded in the importer-country field. No speculative reclassification has been made.
China accounted for 20.16% of August volume, the USA for 16.49%, and Singapore for 9.31%. All three remained the leading destinations, although their August volumes were lower than in July. The UAE strengthened versus July and recorded 4,919.07 MT, or 6.66% of the August total, at an average customs value of USD 7.47/kg.
Average values differed across major destinations
Among the ten largest markets by volume, Turkey recorded the highest August average at USD 7.81/kg. China and the UAE each averaged USD 7.47/kg, while the UK averaged USD 6.08/kg.
These figures should not be treated as direct, like-for-like price comparisons. The supplied data does not normalize kernel grade, size, packaging, contract terms or shipment specification. A higher destination average may therefore reflect a different product or commercial mix.
What the August data means for international cashew buyers
1. Vietnam served a broad international market base
The August file records 78 import markets. This breadth is relevant when evaluating Vietnam as a sourcing origin: trade is distributed across a wide destination base even though the largest markets account for a significant share of monthly volume.
2. Volume declined while average customs value increased
August volume was 7.55% below July, but average value rose from USD 6.88/kg to USD 6.99/kg. The 6.15% decline in aggregate value was smaller than the decline in volume. Procurement teams should monitor both tonnage and unit-value signals.
3. Destination mix remains commercially important
China, the USA and Singapore remained the largest markets, while the UAE strengthened versus July. Buyers should compare offers specification by specification instead of using a national monthly average as a substitute for a commercial quotation.
From market data to procurement decisions
Trade data can help buyers understand where volume is moving, which markets are prominent, and how aggregate value changes month to month. It cannot determine whether an individual supplier or product is the right fit.
A qualified B2B cashew inquiry should define product grade, quality parameters, packaging, required certifications or documentation, destination, target volume and shipment timing.
Review Vietnamese cashew kernels · Quality and specifications · How to order · Request a quotation
FAQ
How much cashew did Vietnam export in August 2026?
The verified August dataset records 73,811.98 MT across 4,792 transactions, with a total customs/trade value of USD 515,880,563.71.
Which were Vietnam’s largest cashew export markets?
By volume, the top three were China at 14,880.93 MT, the USA at 12,170.86 MT, and Singapore at 6,875.58 MT.
Did the average cashew export value decrease in August?
No. It increased from USD 6.88/kg in July to USD 6.99/kg in August, a month-on-month rise of 1.65%, even as total volume and value declined.
Are these the sales or shipment figures of an individual company?
No. These figures are aggregated Vietnam cashew export customs/trade data. They are not the sales, production, customer, market-share, shipment or performance data of any individual company.
Source, methodology and data disclaimer
Source: 0801 - August 2026.xlsx, Sheet1, covering 1–31 August 2026. The verified file contains 4,792 transactions across 348 exporters, 78 import markets and 925 importer records before full normalization. Only HS 08013200 appears in the August file. July figures come from Điều XK T7 2026.xlsx and provide the month-on-month comparison baseline.
“Viet Nam” is preserved as recorded in the importer-country field. Average value per kilogram is an aggregate customs/trade measure, not a quotation for a specific grade or contract.
All figures are aggregated Vietnam cashew export customs/trade data. They are not the sales, production, customer, market-share, shipment, growth or performance data of any individual company. No GA4, Search Console, CRM/RFQ, Facebook Insights or LinkedIn Analytics data has been used or inferred.